Detailed statistics on parties, guests, reservations, servers, and turn times. Make data-driven decisions to optimize your operations.
See your key metrics at a glance with flexible time ranges
Understand your reservation performance with detailed breakdowns of visits, no-shows, and cancellations.
Track server performance with parties seated, guest counts, and turn times
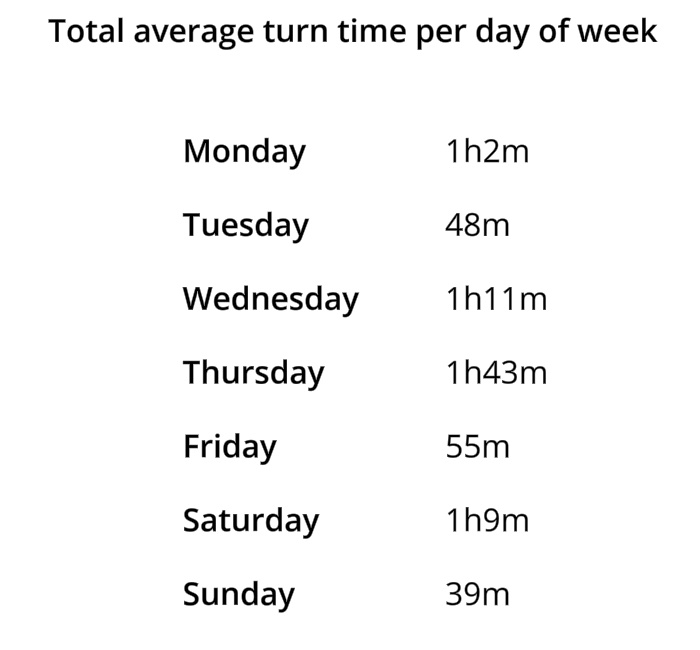
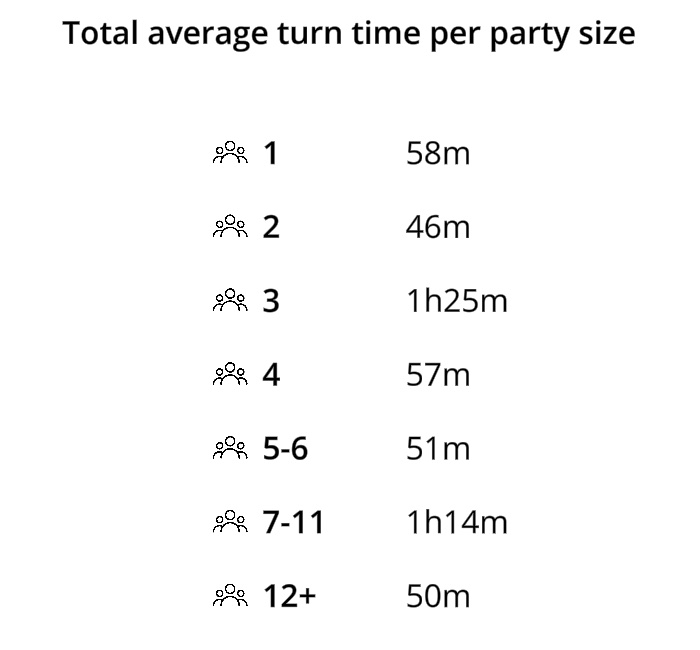
Understand table turnover by meal period and party size
Identify your busiest times and optimize staffing
Comprehensive analytics without the complexity
Switch between time ranges to spot trends and compare performance
Track total parties seated and guest counts for any time period
Visits, no-shows, and cancellations with percentages
Who's the fastest? Track parties, guests, and turn times per server
Average times by meal period and party size
Visual breakdown of guests seated throughout the day
Switch between daily, weekly, and monthly views with one tap. Compare current performance to previous periods to spot trends and measure improvement over time.
Simple Host tracks parties seated, total guests, average party size, turn times, walk-ins vs. reservations, no-show rates, cancellations, server performance, and guests seated per half hour throughout the day.
Turn time measures from when a party is seated to when the table is marked available. You can view average turn times by meal period (lunch vs. dinner) and by party size to understand how long different groups typically stay.
Yes. The server leaderboard shows each server's parties seated, guest count, and average turn time. Use this data to identify top performers and balance workloads fairly.
The guests-per-half-hour chart shows exactly when you're busiest throughout the day. Use this to optimize staffing levels—schedule more servers during peak times and fewer during slow periods.
Yes. See your no-show count and percentage for any time period. Track whether SMS reminders and confirmation texts are helping reduce no-shows over time.
Currently, statistics are viewable within the Simple Host app. Export functionality for spreadsheets and reports is on our roadmap for a future update.
Basic statistics are included in all plans. The Professional and VIP plans include advanced analytics like server performance tracking and turn time breakdowns.
Download Simple Host and get instant access to powerful analytics that help you optimize operations.
